Data properties
##Mean
> mean(faithful$eruptions)
[1] 3.5
Median
> median(faithful$eruptions)
[1] 4
Quartile
Quartile is calculated by distributing the population into 4 equal parts, irrespective of the values contained in that data set. This is done on the sorted data frame.
> quantile(faithful$eruptions)
  0%  25%  50%  75% 100%
 1.6  2.2  4.0  4.5  5.1
Values 25% is the instance where it cuts 25% data.
Percentile
On similar concepts, we can calculate 1/100th parts and hence n parts out of these data portions to contribute to the percentile.
To calculate 69th percentile, one has to find value that separate 69th part of the data from 70th.
> quantile(faithful$eruptions, .69)
69%
4.3
> quantile(faithful$eruptions, c(.69,.22))
69% 22%
4.3 2.1
>
Inter Quartile Range
Difference between 25% and 75% range of the data
> quantile(faithful$eruptions)
0% 25% 50% 75% 100%
1.6 2.2 4.0 4.5 5.1
> IQR(faithful$eruptions)
[1] 2.3
> # See 2.3 is the difference between 75% and 25% reading
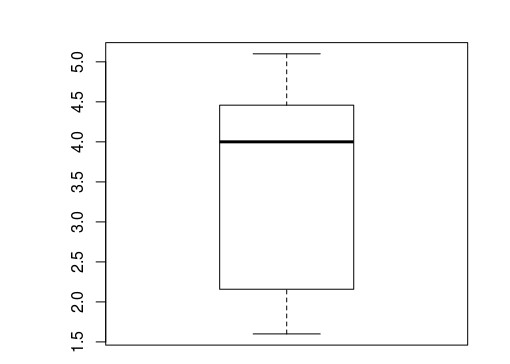
>Boxplot for analysing above measures
Boxplot captures the spread between 2nd and 3rd quartile (i.e. 25%, 75%).
> boxplot(faithful$eruptions)Boxplot for eruptions
Variance
Here one has to take care of the difference between a. Sample b. Population variances.
For our calculations through R, we do
> var(faithful$eruptions)
[1] 1.3
Standard Deviation
It is square root of variance. In R, we do..
> sd(faithful$eruptions)
[1] 1.1
Covariance
This gives an indication how two parameters vary w.r.t. each other.
> cov(faithful$eruptions, faithful$waiting)
[1] 14
Positive number indicates eruptions increase as waiting increase.
Correlation Coefficient
It provides the rate at which two parameters vary given they have +/- covariance. It is calculated by dividing covariance with sd of both the variables. In R, we use cor()
> cor(faithful$eruptions, faithful$waiting)
[1] 0.9
This number being close to 1, indicates that the two parameters are linear function of each other.
Skewness, Kurtosis, Central Moment
For these items, we need to load library E1071
#download library from shell prompt
wget https://cran.r-project.org/src/contrib/e1071_1.6-6.tar.gz

#from within R shell
install.packages("~/R/e1071_1.6-6.tar.gz", repos=NULL, type="source")

###Central Moment
2nd order of central moment is same as variance.
> moment(faithful$eruptions, order=3, center=TRUE)
[1] -0.61
Skewness
> skewness(faithful$eruptions)
[1] -0.41
Negative means, it is skewed towards left.
Kurtosis
> kurtosis(faithful$eruptions)
[1] -1.5
Negative number indicates flat normal curve, also known as platykurtic Positive number would have meant peaked curve, also known as leptokurtic